North Carolina’s A-F grading system has been used to evaluate NC public schools since the 2013-14 school year, but the system’s deeply flawed formula produces grades that completely fail to provide meaningful information about school quality. People usually expect grades to align well with what’s being graded. When a school is assigned an A through F grade, the public generally assumes that the grade reflects the relative quality of the school and what’s happening within the school building and classrooms in terms of instructional quality and educational environment. In the case of the NC A-F grading system, this assumption is false.
To frame the issue using a different context, imagine a system that graded weight loss clinics based on the average weight of their clients. The system would be loudly ridiculed. A grade based on average weight makes no sense because it doesn’t account for how much weight clients lose, their health status beyond weight, nutrition education provided at the clinics, or the many other relevant factors affecting the quality of a clinic.
Just like this outlandish clinic grading system, the NC school grading system has a flawed focus. The grades tell us much more about who attends the schools than the learning taking place inside the schools.
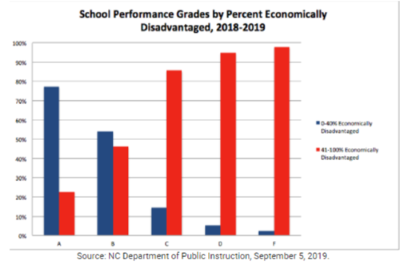
In general, school performance grades simply reflect the economic realities of the students attending the schools. As economic advantage grows, so do the grades. The chart below shows that schools with 0-40% economically disadvantaged students (blue) are much more likely to get As than Fs and the reverse is true for schools with 40% – 100% economically disadvantaged students (red). The NC Justice Center’s report School Performance Grades: A Legislative Tool for Stigmatizing Non-White Schools points out the many harmful effects of the current system.
So why does the NC school grading system persist in its current form? Over the years, there have been multiple bipartisan attempts to change the formula, but none has succeeded.
Since its inception, the formula used to determine a school’s overall grade has focused on a few test scores. Virtually all of the grade, 80%, comes from an achievement score while just 20% comes from a growth score. The achievement score, in turn, is mostly produced from scores on EOG or EOC tests that represent a small portion of a school’s overall academic offerings.
The green bars below show the number of courses with EOG or EOC tests that contribute to a school’s achievement score. The far larger blue bars represent the courses that do not contribute to a school’s score.
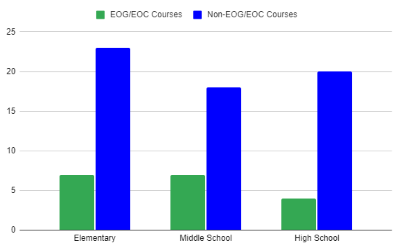
In elementary and middle schools, the progress of English Learners (EL) on language assessments also contributes to the achievement score. High school adds the 4-year graduation rate, a measure of rigor using Math III courses, and ACT/WorkKeys scores. However, when viewed from the perspective of a school’s complete array of academic courses, the achievement score elements represent a very small proportion – much less than what would be needed to assign a meaningful grade.
The 20% growth score is based on a statistic that uses students’ test results (on the same few EOG and EOC assessments) to provide an indication of how much learning has taken place within a given school year. The growth score is a much better indicator of what’s happening within a school building than the achievement score, yet it still makes up a far smaller proportion of NC school grades.
The school performance grades are published online each year as part of the NC School Report Cards. In addition to the overall grade, a number of meaningful metrics on school quality and climate (e.g. teacher qualifications, average class size) are also reported. But unfortunately, the overall grade is the most prominent.
In contrast, there is no grading system in place to monitor private schools that receive public money through NC’s educational voucher program or its homeschool program.
If NC policymakers are serious about monitoring how public funds are spent on education, they should be as concerned with money going to non-public entities as with money going to public schools. Where a grading system is used, it should be applied to all schools that receive public funds.
Talk to your legislators about revising the current school grading system and ask them to create one that actually informs the public about what’s happening inside school buildings. The current school performance grades fail in this regard. The NC General Assembly can look to examples from numerous other states for better systems to implement here. Our educators and all citizens deserve more than the misleading school performance grades we have now.